Making phylogenetic trees takes many steps and requires the use of several online resources.
iTOL, or the Interactive Tree of Life, will automatically generate a tree of life based on NCBI identifiers. To use iTOL you will need the NCBI scientific name (including proper capitalization); just replace the space with an underscore. If you aren't sure about a species scientific name, you can search Ensembl, NBCI, or even Wikipedia.
Here is what I used to look at amniote evolution.
Mus_musculus
Homo_sapiens
Gallus_gallus
Taeniopygia_guttata
Alligator_mississippiensis
Xenopus_laevis
Trachemys_scripta
Pelodiscus_sinensis
Anolis_carolinensis
Danio_rerio
Homo_sapiens
Gallus_gallus
Taeniopygia_guttata
Alligator_mississippiensis
Xenopus_laevis
Trachemys_scripta
Pelodiscus_sinensis
Anolis_carolinensis
Danio_rerio
HOW DO I GENERATE THE TREE?
Enter in the scientific names and click generate tree. iTOL has many
features, which you can explore. I didn't particularly like their user
interface, so I simply used them to give me the Newick text. Newick text is just a way to represent trees in a language computers can easily 'read.'

After you generate the tree, you will be given Newick text, that establishes the tree structure. You can use the taxonomy IDS or scientific names. If the internal nodes are expanded, you will have a very large and detailed tree.
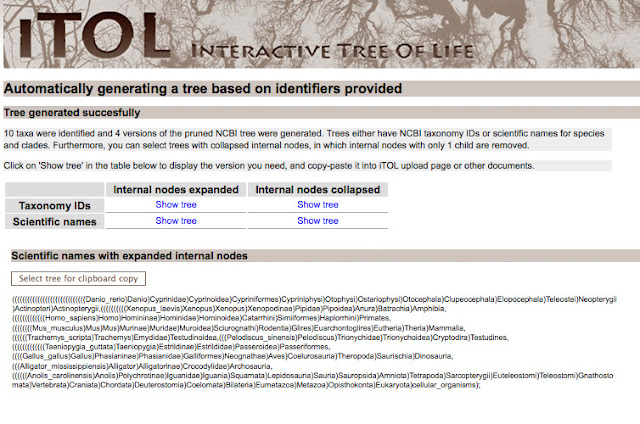
For my purposes, I wanted to a tree with the internal nodes collapsed. For making a publication quality figure, it's less crowded.
Next, I copied the text and pasted the following text into University of Indiana's Phlyodendron.
(((Xenopus_laevis,((Mus_musculus,Homo_sapiens) ,((Pelodiscus_sinensis,Trachemys_scripta) ,(Anolis_carolinensis,((Gallus_gallus,Taeniopygia_guttata) ,Alligator_mississippiensis)Arch)Sauria)Saurop)Amniota)Tetra,Danio_rerio) );
The original text was actually:
(((Xenopus_laevis,((Mus_musculus,Homo_sapiens)Euarchontoglires,((Pelodiscus_sinensis,Trachemys_scripta)Cryptodira,(Anolis_carolinensis,((Gallus_gallus,Taeniopygia_guttata)Neognathae,Alligator_mississippiensis)
Archosauria)Sauria)Sauropsida)Amniota)Tetrapoda,Danio_rerio)Euteleostomi);
But I replaced Euteleostomi, Neognathae, Cryptodira, Euarchontoglires with spaces. I also abbreviated a few names, so they didn't intersect with the lines. I want my final figure to look clean. Next, I chose to output a phenogram tree.
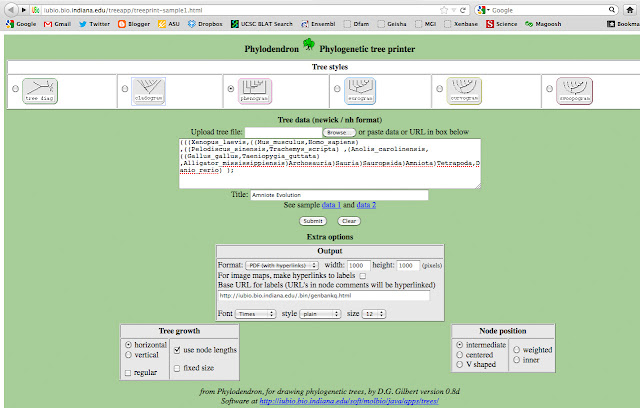
That will generate a PDF file, that looks like this:

HOW DO I MAKE IT LOOK GOOD?
Now, I use Photoshop to spruce up the image. First, I make the image I want to create a time line on the bottom and check the dates of each node. In general, I will compact the vertical lines to make it tighter. This is where a bit of awareness in image composition comes in handy. You don't want your image too look too spaced out or too crowded. Choose a color scheme that is not too jarring or too pale. The image composition should not distract from the information you are trying to convey!
USE LAYERS
When you begin adding features to your Photoshop file, you will want to make a new layer for each item, name it and keep track of what layer you are working on at all times. Keep a separate layer for the tree, the time scale, the boxes, each name, etc. You will thank me later! Save it as a .psd file.
SAVE MANY, SAVE OFTEN
I also like to save different versions every time I make a radical change. v_1, v_2, v_3. There are countless times I have had to use a backup file.

I recommend using Illustrator if you want a high-quality
publication-ready figure. The use of vectors in your images will allow
the image to still look great at different sizes. You can open your .psd Photoshop file in Illustrator. My general design was based on Sudhir Kumar's TimeTrees. It's a wonderful site, accompanied by a wonderful book and I highly recommend checking it out.
VECTORS ARE BETTER
If you use Adobe
Illustrator, you can save your image as a PDF file. Try zooming in and
out of your image. I am not going to give a lecture on what vectors are (Google it!), but with vectors, instead of bmps, the image will still
look great at many scales (instead of pixelated). This is especially true for the text, which often becomes distorted.
KNOW YOUR FILE SIZE REQUIREMENTS
If you are making the figure for a publication, you will need to consult their graphic or artwork guide. There are usually 3 sizes you can make your image:
1) Single column width in a double column paper
2) One and a half width
3) Full page width
For each of these sizes, you should make sure the image resolution is up to par. I like to have at least 300 resolution and a large document size. In general, if an image looks great when it's big, it will continue to look great as you shrink it down. The same is not true if you do it the other way around.

While each publication company has different requirements, some general sizes are:
DESIRED SIZE SIZE DPI
Single column width - 90 mm ~ 3500
One and half page width - 140 mm ~ 5500
Full page width - 190 mm ~ 7500
WHAT DATES SHOULD I USE?
There is, of course, always controversy in obtaining accurate evolutionary dates. They are estimates, at best, and having several sources to base your estimates off of is the best strategy. I love using the Time Tree program. It pulls in many sources indicating species molecular estimates. You can click on each paper and decide on what date you want to use for your tree.

Good luck with your tree making!
No comments:
Post a Comment